Building a terminal packet sniffer
I wanted to actually understand what crosses a network — not read about it. So I built Packet Analyzer: a Wireshark-lite that lives in the terminal, captures live traffic, parses protocols, and flags suspicious patterns in real time. This is how it works and what building it taught me.
Why a terminal, not a GUI
Wireshark is superb, and rebuilding it wasn't the point. The point was to own every layer myself — to know exactly how a raw frame becomes "TCP · 192.168.1.5 → google.com · 443." A terminal tool forced that: no chart library to hide behind, just bytes, a parser I wrote, and a dashboard I had to lay out by hand. It also runs anywhere over SSH, on a store back-office box with no display, which is the environment I actually work in.
The shape: producer / consumer
Capture and rendering have opposite temperaments. Capture must never block — drop a packet and it's gone forever. Rendering wants a calm, fixed cadence. So they're split into a producer and a consumer that share state through a thread-safe buffer:
- Producer — a wrapper around Scapy's
AsyncSniffer(libpcap underneath). It grabs frames off the wire, hands each to the parser, and pushes the result into shared state. Its only job is to be fast and never stall. - Shared state — a ring buffer (the last ~10,000 packets), rolling counters, and a top-talkers table. Bounded on purpose: a sniffer that runs for hours can't grow without limit.
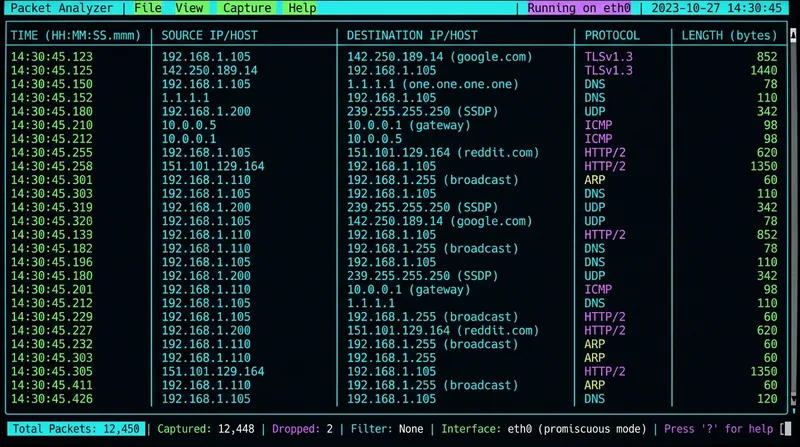
- Consumer — a Textual TUI that reads that state ~10×/second and redraws the live feed, the rolling packet-rate and bandwidth, the protocol mix, and an alerts panel. It never touches the wire; it only reads.
That separation is the whole design. Once capture can't be slowed by drawing and drawing can't be starved by capture, everything else is detail.
Parsing, layer by layer
Each packet is peeled in order — Ethernet → IP/IPv6 → TCP/UDP/ICMP → HTTP/DNS — pulling out only the fields that matter for the feed and the detectors. The parser is deliberately forgiving: malformed or truncated packets are common in the wild, and one bad frame must never take down the capture loop. Anything it can't parse still counts toward the stats; it just doesn't get a pretty label.
Detectors are plugins, not if-statements
The interesting part isn't showing traffic — it's noticing when traffic is wrong. Rather than bury heuristics in the render loop, each threat model is its own small module behind a common interface, so adding a detector never touches the pipeline:
- SYN flood — half-open connections per source over a window
- ICMP flood — ping-storm rate per source
- Port scan — unique destination ports a single source touches
- DNS anomalies — over-long queries, high-entropy names (tunneling/DGA tells), TXT-record volume, NXDOMAIN bursts
- Statistical anomaly — a rolling z-score on packets/sec and bytes/sec, so a spike that no fixed rule anticipated still trips an alert
The z-score detector is the one I'm proudest of: it doesn't need to know what the attack is. It learns the network's normal rhythm and flags deviation. Signature rules catch the attacks you named; the statistical one catches the shape of the ones you didn't.
Offline too: PCAP in, report out
Live capture needs root. Analysis shouldn't. So the same parser and detectors run over a saved .pcap with --pcap — no sudo, ideal for labs, demos, or picking apart a capture after the fact. It prints a concise summary (packet and byte totals, duration, protocol breakdown, top sources, alerts) and can export packet-level JSON/CSV for a notebook. In the live TUI, pressing w dumps the buffered frames to a timestamped .pcap you can hand straight to Wireshark or tshark — the two modes feed each other.
What it taught me
Three things stuck. First, back-pressure is a design decision, not an afterthought — the bounded buffer and the producer/consumer split are what keep it honest under load. Second, a plugin seam pays for itself immediately: every new detector was a file, never a surgery. Third, and most useful for the day job, you understand a protocol properly only when you've had to parse it wrong — the malformed DNS packet that crashed an early build taught me more than any RFC.
It's the clearest example of how I approach security: not as a checklist, but as building the tool that lets me see.